Short answer
The “Schumann resonance today” that people look up is a live spectrogram of Earth’s natural electromagnetic background: a set of standing waves in the cavity between the ground and the ionosphere, with a fundamental near 7.83 Hz. The colourful live charts plot electromagnetic power over time, driven by global lightning.1 A “spike” means more energy in the field, not a change in the frequency, and as of 2026 there is no measured effect on your body.
Key takeaways
- The live chart is an instrument readout. It shows the strength (amplitude) of Earth’s electromagnetic resonance minute by minute, not a signal about you or “mass consciousness.”
- A spike is power, not frequency. A bright patch means more or closer lightning energy in the cavity. The fundamental stays near 7.83 Hz; it does not jump to 40 Hz.3
- No proven physiological effect. There is little to no credible evidence that a spike on the chart changes how you feel today.4
- Geomagnetic storms are a separate thing. If you want to track real space weather, watch the Kp index, not the Schumann chart.5
- Know the source. Popular charts come from Tomsk in Russia and from HeartMath, an advocacy group, not a neutral geophysics lab.2
Schumann resonance today at a glance
| Question | Short answer |
|---|---|
| What is the live chart? | An amplitude spectrogram: frequency on the y-axis (0 to 40 Hz), time in UTC on the x-axis, colour showing power |
| What does a “spike” mean? | More electromagnetic power, usually more or closer lightning, not the 7.83 Hz frequency changing |
| Does today’s reading affect me? | No measured physiological effect; the chart reads the sky, not your body |
| What are the black vertical bars? | Missing data, when the instrument dropped out, not a planetary event |
| Who runs the charts? | Tomsk State University’s Space Observing System and HeartMath’s magnetometer network |
| Where is the real space weather? | NOAA’s Kp index and geomagnetic-storm alerts |
What the live Schumann resonance charts actually show
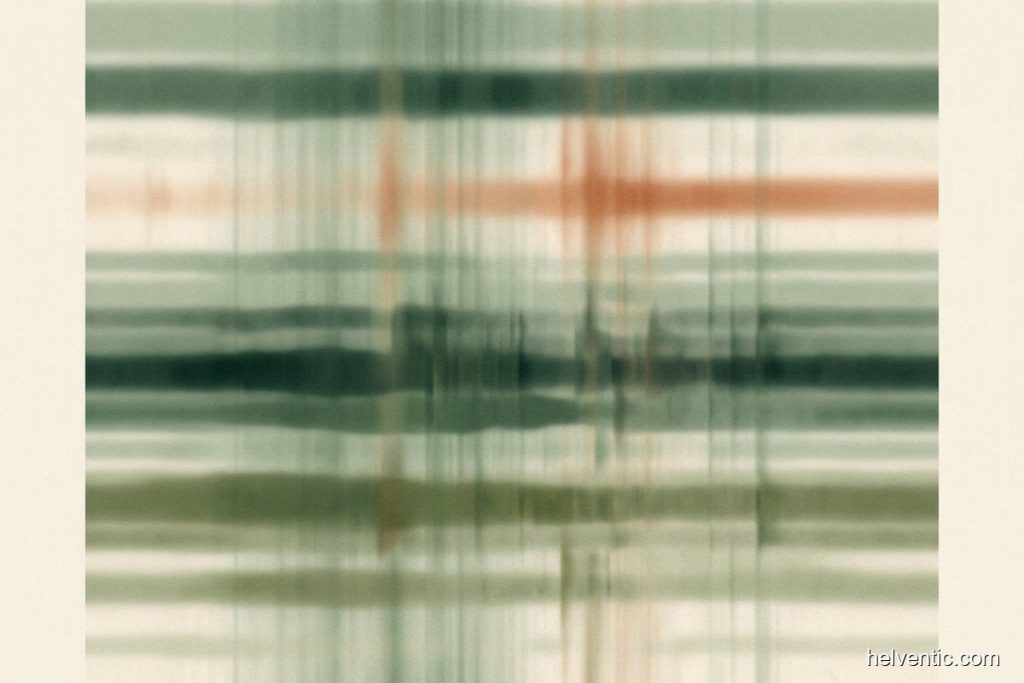
When a post says “look at the Schumann resonance today,” it is almost always pointing at one image: a rectangle of stacked colours that looks a bit like a weather radar sweep. That image is a spectrogram from the Tomsk State University Space Observing System, a physics instrument in Siberia that has been repackaged online as “the Schumann chart.” It measures the strength of Earth’s natural electromagnetic resonance, the standing waves that ring in the waveguide between the surface and the ionosphere after every lightning flash. Roughly 50 lightning strikes hit the planet every second, and each one nudges the cavity, keeping a faint ELF (extremely low frequency) tone alive near 7.83 Hz.1
So the chart is real data. It is not a readout of human health, mood, or collective awareness. The resonance was predicted by physicist Winfried Otto Schumann in 1952 and is now used to monitor global lightning and the lower ionosphere. For the full physics, see our complete guide to the Schumann resonance. Here we focus on what people actually want when they type “schumann resonance today”: how to read the live data without being misled by it.
How to read a Schumann resonance spectrogram
Once you know the axes, the mystery drains out of the picture. The vertical axis is frequency, usually 0 to 40 Hz, so the fundamental at about 7.83 Hz and its higher modes near 14, 20, 27 and 34 Hz appear as horizontal bands. The horizontal axis is time, marked in UTC (coordinated universal time), which is why the labels rarely match your clock. The colour is the key: it encodes power, or amplitude, with brighter colours meaning a stronger field at that frequency and moment.1
Two features trip people up. Solid black vertical bars are not an ominous silence from the planet; they are gaps where the instrument lost data. Bright vertical streaks that cut across every frequency are usually local lightning near the sensor, a burst of broadband energy, not a message. Read the horizontal bands for the resonance itself, and treat the vertical marks as instrument noise and weather.
What a Schumann resonance “spike” really means
The word “spike” is where most of the confusion starts. On the chart it is just a patch of bright colour, and bright colour means amplitude, the power in the field. When the tropical thunderstorm regions are especially active, or a storm sits close to the Tomsk sensor, the cavity rings harder and the colours brighten. That is more electromagnetic energy at the usual frequencies. It is not the 7.83 Hz tone climbing to a new pitch.2 The fundamental frequency has stayed in a narrow band around 7.8 to 8.0 Hz since instrumental records began in the 1960s, wobbling only about 0.1 Hz with the solar cycle.3
If you have seen claims that a spike proves the frequency is “rising to 40 Hz,” that is a misread axis. The 40 Hz is simply the top of the chart’s frequency scale, and the higher bands are harmonics, not the fundamental moving. We cover that specific myth in detail in is the Schumann resonance rising?
Does a spike today affect you?
No one has measured a reliable effect. The BBC Sky at Night explainer puts it plainly: there is little to no evidence that the Schumann resonances have any effect on biological life, and the health claims should be taken “with several shovels of salt.”4 Part of the reason is scale. The natural Schumann magnetic field is vanishingly weak, on the order of picotesla, which is millions of times fainter than the fields from your household wiring. A brighter chart today is more lightning over the tropics, not a force acting on your nervous system. For the full evidence review, see Schumann resonance health effects.
Geomagnetic storms are the real space weather (and they are separate)
There is a genuine, measurable phenomenon that people often confuse with a Schumann “spike”: the geomagnetic storm. When the Sun launches a burst of charged particles, Earth’s magnetic field is disturbed, and NOAA tracks this with the Kp index and its geomagnetic-storm alerts.5 This is a far stronger and more variable thing than the steady 7.83 Hz tone, and it is what you should watch if solar activity interests you.
Geomagnetic storms do have a small, mostly ecological research literature attached to them. A 2025 scoping review of 36 studies found significant storm-related correlations in most of them but graded the field as “preliminary,” and a large cohort study reported a modest drop in heart-rate variability after intense geomagnetic disturbance.67 These effects are weak, appear mostly in already-vulnerable people, and are about storms, not the Schumann chart. If you track your own physiology, our guide to heart-rate variability explains what actually moves that number day to day.
Who runs the charts, and where to see real data
Two names dominate the “Schumann resonance today” results. The Tomsk Space Observing System is a legitimate research instrument; its spectrogram is scientifically sound, it is just being read for the wrong purpose online. The other is HeartMath’s Global Coherence Initiative, an advocacy organisation built around a “global consciousness” thesis that sits outside mainstream geophysics.2 Its charts are drawn from real magnetometers, but the interpretation layered on top is the organisation’s own belief, not a neutral finding. Treat HeartMath as an interested party, the way you would any group publishing data that supports its own mission.
For trustworthy numbers, go to the source instruments and to NOAA for space weather, rather than to reposted screenshots with dramatic captions. The chart itself is fine; the captions are usually the problem.
Last reviewed July 2026.
Frequently asked questions
What is the Schumann resonance today?
It is the live reading of Earth’s natural electromagnetic resonance, shown as a spectrogram with frequency on the y-axis, time in UTC on the x-axis, and colour for power. The fundamental sits near 7.83 Hz. “Today’s” chart just shows how strong that field is right now, which mostly tracks global lightning activity.
What does a Schumann resonance spike mean?
A spike is a bright patch on the chart, which means more electromagnetic power at that moment, usually because thunderstorm activity increased or moved closer to the sensor. It is amplitude going up, not the 7.83 Hz frequency changing. There is no measured link between a spike and your health, mood, or sleep.
Is the Schumann resonance frequency changing or rising?
No. The fundamental has stayed near 7.8 to 8.0 Hz since the 1960s, moving only about 0.1 Hz with the solar cycle. The “rising to 40 Hz” idea comes from misreading the chart, where 40 Hz is just the top of the frequency axis and the higher bands are harmonics, not the fundamental moving.
Are the black bars on the chart a warning sign?
No. Solid black vertical bars are missing data, times when the instrument dropped out or was offline. Bright vertical streaks are usually local lightning near the sensor. Neither is a planetary event. Read the steady horizontal bands for the resonance itself and ignore the vertical marks.
Should I watch the Schumann chart or the Kp index?
For real space weather, watch NOAA’s Kp index and geomagnetic-storm alerts. Geomagnetic storms are a stronger, well-defined phenomenon, unlike the steady Schumann tone. The Schumann spectrogram is interesting physics, but it is a lightning and ionosphere monitor, not a space-weather forecast or a health indicator.
Is HeartMath a reliable source for Schumann data?
HeartMath’s magnetometer data is real, but the organisation is an advocacy group promoting a “global coherence” idea that mainstream geophysics does not accept. Its charts come with an interpretation that supports its own mission. Use the raw data cautiously and get your physics from neutral sources like NASA, NOAA, and university observatories.
References & sources
- NASA Scientific Visualization Studio. Lightning Reverb. Global lightning drives Earth’s Schumann resonance near 7.83 Hz; ionosphere roof near 100 km. svs.gsfc.nasa.gov ↩
- Wikipedia. Schumann Resonances Conspiracy Theories. Spectrogram spikes track lightning and the ionosphere and have no demonstrated bearing on mass consciousness; HeartMath framing noted. en.wikipedia.org ↩
- Long-term stability of the Schumann resonance fundamental frequency (solar-cycle variation only, no secular rise). Atmosphere (MDPI). 2022;13(1):38. doi:10.3390/atmos13010038 ↩
- BBC Sky at Night Magazine. Schumann resonances. Explainer noting little to no evidence of an effect on biological life. skyatnightmagazine.com ↩
- NOAA Space Weather Prediction Center. Geomagnetic storms. Definition and the Kp index for tracking real space weather. spaceweather.gov ↩
- Scoping review of geomagnetic activity and cardiovascular outcomes (36 studies; 28 significant, 8 null; graded “preliminary”). Cureus. 2025. doi:10.7759/cureus.99851 ↩
- Normative Aging Study cohort (n=809): intense geomagnetic disturbance associated with reduced heart-rate variability. Science of the Total Environment. 2022;838:156235. doi:10.1016/j.scitotenv.2022.156235 ↩
Sources retrieved via PubMed and the cited institutions. This article is informational and not medical advice. Last reviewed July 2026.