
Short answer
The Schumann resonance is a set of natural electromagnetic waves that resonate in the thin cavity between Earth’s surface and the ionosphere, with a fundamental frequency near 7.83 Hz.1 It is real, measured geophysics, driven by lightning. Claims that this Schumann frequency heals the body, tunes your brainwaves, or is steadily rising are not supported by the evidence.
Key takeaways
- It is settled physics. The Schumann resonance is a global electromagnetic phenomenon in the Earth-ionosphere cavity, predicted in 1952 and measured continuously since the early 1960s.
- 7.83 Hz is the fundamental, not a magic number. Higher modes sit near 14, 20, 27 and 34 Hz. They are approximate, not exact multiples, and the whole set drifts only slightly.
- Lightning powers it. Around 50 lightning flashes a second, from roughly 2,000 storms active at any moment, keep the cavity ringing. “Earth’s heartbeat” is a metaphor for that steady pulse, not a biological claim.
- The health and consciousness claims are unproven. The natural field is vanishingly weak (picotesla), and there is no credible evidence it heals, raises mood, or is “rising” toward 40 Hz.
- Keep three things apart: the real physics, the separate and much stronger geomagnetic storms (a weak but real research area), and the 7.83 Hz wellness folklore.
Schumann resonance at a glance
| Question | Short answer |
|---|---|
| What is it? | Global standing electromagnetic waves in the cavity between Earth and the ionosphere |
| Fundamental frequency | About 7.83 Hz, in the extremely low frequency (ELF) band |
| What drives it? | Global lightning, roughly 50 flashes per second worldwide |
| Who found it? | Predicted by Winfried Otto Schumann in 1952; confirmed 1954, mapped 1960 to 1963 |
| Is it rising? | No. It has stayed near 7.8 to 8.0 Hz since the 1960s, with a tiny solar-cycle wobble |
| Does it affect health? | Real physics, but no proven human health effect; the field is far too weak to feel |
| Is it dangerous? | No. Reviews find no established hazard from low-level ELF fields at natural strengths |
What the Schumann resonance actually is
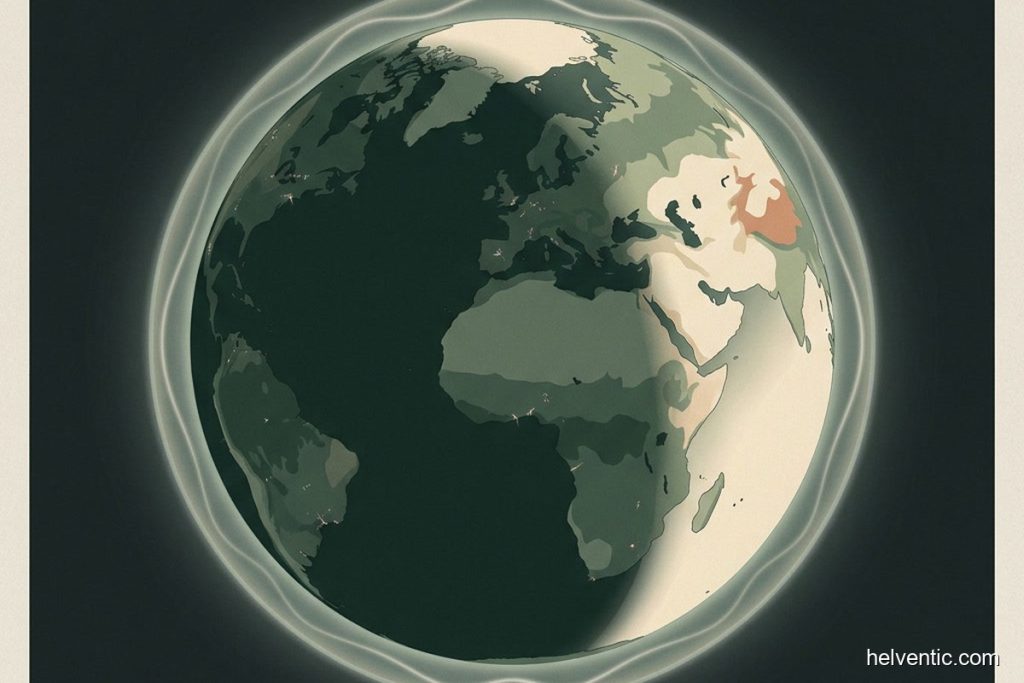
Picture Earth wrapped in two conductive shells. The ground beneath you conducts electricity, and so does the lower ionosphere, a layer of charged particles that begins roughly 60 miles (about 100 km) up.2 The air between them does not. That arrangement, a poor conductor sandwiched between two good ones, behaves like a giant resonant cavity, or waveguide. When you feed energy into a cavity of a fixed size, only waves of certain wavelengths fit neatly inside and reinforce themselves. Those are its resonant frequencies.
The Schumann resonance is the set of extremely low frequency (ELF) electromagnetic waves that “fit” this planet-sized cavity. They are standing waves: patterns that circle the globe and overlap with themselves, adding up at particular frequencies. The lowest and strongest of these, the fundamental mode, sits near 7.83 Hz.1 This is ordinary classical electromagnetism, the same physics that governs radio. It is not sound, and there is nothing mystical about it. Taken together, these low-frequency electromagnetic waves make up a single global electromagnetic resonance phenomenon: one Schumann resonance signal in Earth’s atmosphere that every point on the planet shares at the same instant.
Two practical points follow from the word “electromagnetic.” First, 7.83 Hz is far below the range of human hearing (roughly 20 Hz and up) and far below any radio station on your dial, so you cannot hear it and your body does not sense it. Second, the signal is detected with sensitive magnetometers and antennas at quiet monitoring sites, not by any organ or instrument in the human body. When people talk about “feeling” the Schumann resonance, they are describing an idea, not a measured biological signal.
Who discovered it, and when
The German physicist Winfried Otto Schumann (not the 19th-century composer Robert Schumann, a mix-up you will see online), working at the Technical University of Munich, predicted these resonances in 1952 from Maxwell’s equations and the geometry of the Earth-ionosphere gap.3 He and his doctoral student Herbert Konig reported the first experimental confirmation in 1954. The definitive measurements, clean spectra showing the peaks exactly where theory placed them, came from Balser and Wagner between 1960 and 1963. So the phenomenon carries one man’s name, but it took a decade of instruments to pin down. That timeline matters, because it means we have a continuous measured record stretching back more than sixty years, which is precisely what lets scientists say the frequency has not drifted upward.
Why the frequency is near 7.83 Hz
There is a simple version of the answer and a more honest one, and most explanations stop at the simple one. The intuitive picture is that the strongest standing wave is one whose wavelength wraps once around the planet. Divide the speed of light by Earth’s circumference and you get roughly 7.5 Hz, close to what we observe. NASA describes it that way: a wave “as long as the circumference of Earth.”2
The catch is that the rigorous, idealized formula for a perfect lossless cavity actually predicts about 10.6 Hz for the fundamental, not 7.83. The observed value comes out lower because the real ionosphere is a lossy, imperfect conductor that damps and shifts the resonance. So “wavelength equals circumference” is a useful mental model, but the true number is the product of real atmospheric physics, not a tidy round figure someone chose. Anyone telling you 7.83 Hz was handpicked by nature as a healing frequency has skipped this part.
The harmonics: 7.83 Hz and its higher modes
The fundamental is not alone. Above it sit weaker higher modes, popularly listed near 14, 20, 27 and 34 Hz.1 One important detail that pseudoscience gets wrong: these are approximate, and they are not exact integer multiples of 7.83. Different sources quote slightly different values (NASA’s physics set runs closer to 14.1, 20.3, 26.3 and 32.5 Hz), because the same lossy-cavity effects that lower the fundamental also nudge each harmonic. Treat them as a ladder of roughly evenly spaced peaks, not a clean series of doublings. Physicists call this whole family the cavity’s natural frequencies, or its resonance frequencies: the specific tones the Earth-ionosphere waveguide will ring at once lightning excites it. The Schumann resonance frequencies are a property of the cavity’s size and shape, which is why the set barely moves.
What powers it: lightning, not a heartbeat
The cavity would fall silent without something to excite it, and that something is lightning. At any given moment about 2,000 thunderstorms are active around the planet, together producing roughly 50 flashes every second.2 Each flash is a burst of electromagnetic energy that pings the cavity, and the accumulated pinging keeps the resonance alive as a continuous, planet-wide hum. Most of it comes from three tropical lightning zones, over Southeast Asia, Africa and the Americas, which take turns as the Sun moves and each region warms into its afternoon storms. That daily rhythm, with broad peaks in power at roughly 09, 14 and 20 UT, is one reason the amplitude on a live chart rises and falls even on an ordinary day.
You will often see the Schumann resonance called “Earth’s heartbeat.” It is a nice metaphor for a steady, global electromagnetic pulse, and NASA has used similar language. But it is only a metaphor. The planet does not have a pulse in any biological sense, and the resonance is not a life force or a signal your cells are “listening” to. It is the electromagnetic echo of thunderstorms.
Does the Schumann resonance change over time?
Yes, but far less dramatically than the internet suggests. The fundamental fluctuates within a narrow band, roughly 7.8 to 8.0 Hz, over the course of a day and across seasons, mostly because the ionosphere sits lower at night and higher in daylight. These variations in the Schumann resonance are real but small, and they are cyclical rather than one-directional. The largest slow change tracks the roughly 11-year solar cycle: a shift on the order of 0.1 Hz as solar activity rises and falls, a tiny, reversible wobble.4
What there is no sign of is a sustained upward trend. Across the entire instrumental record since the 1960s, the fundamental has stayed near 7.8 Hz. The popular claim that it is “rising” toward 30 or 40 Hz confuses a few different things: the top of a chart’s frequency axis, the higher harmonics, and short bursts of amplitude. We take that myth apart in is the Schumann resonance rising?. If you have landed here because you saw a dramatic chart today, start with how to read the live Schumann resonance charts, because what looks like a spike is almost never the frequency moving.
What scientists actually use it for
Away from the wellness world, the Schumann resonance is a genuinely useful geophysical measurement tool, and this is the part that rarely makes it into viral posts. Because the signal is a direct product of global lightning, monitoring it is one of the best ways to track worldwide thunderstorm activity, including storms over oceans where no rain gauge reaches. That same link makes it a proxy for tropical temperature and a lever in climate research, since a warmer tropics tends to mean more lightning.
Researchers also use it to study the lower ionosphere and space weather, and even to probe the atmospheres of other planets. NASA’s real connection to the Schumann resonance is not a spacecraft generator, a piece of folklore we address below, but remote sensing: instruments have detected this resonant energy leaking above the atmosphere, which helps scientists study the environment from orbit.2 Using the resonance to forecast earthquakes has been explored too, but that remains speculative and is not established science.
How the Schumann resonance is measured
Because the natural signal is so faint, the study of the Schumann resonance is done entirely with instruments. Research groups record it using induction-coil magnetometers and long antennas at electromagnetically quiet sites, well away from power lines and traffic, then run the raw trace through a spectrum analyser to lift the resonance peaks out of the background noise.1 What comes out is a row of narrow spectral peaks at the natural frequencies of the cavity, with the fundamental resonance frequency near 7.83 Hz standing tallest and each higher mode a little weaker.
Plotting how the amplitude of those peaks changes through the day is what gives the live data you see on public monitors. Because the signal is a direct readout of global lightning activity, that same feed doubles as a research tool for tracking worldwide storms and probing the electromagnetic environment of the lower atmosphere. The daily modulation, stronger while the tropics move into their afternoon thunderstorm activity, is lightning doing its work, not the base frequency drifting. That distinction, amplitude versus frequency, is the single thing most “live Schumann resonance” posts get wrong.
Does the Schumann resonance affect human health?
This is where the topic usually goes off the rails, so it helps to take it in tiers. The short answer: the physics is real, the effects on human health and well-being are unproven, and the natural field is far too weak to plausibly do much. For the full evidence review, see our companion page on Schumann resonance health effects.
First, the direct human evidence for the 7.83 Hz tone itself is thin. One small double-blind randomized trial (n=40) reported that a Schumann-resonance sleep device improved insomnia measures versus placebo, which is interesting but needs independent replication before it means much.5 A 2025 mechanistic review argues that cells might be tuned to 7.83 Hz through radical-pair or calcium pathways, but the authors themselves call it a hypothesis requiring “further research.”6 That is the state of play: a plausible idea, not a demonstrated effect.
Second, and this is the crucial distinction, most of the serious “space weather and health” research is about geomagnetic storms, not the steady Schumann tone. Storms are a completely different, far stronger and highly variable phenomenon, bursts of solar wind disturbing Earth’s magnetic field.7 A meta-analysis links intense storms to a modest rise in heart attacks and strokes, on the order of 25 to 50 percent higher risk, mainly in already-vulnerable people.8 A large cohort (n=809) found reduced heart-rate variability after intense geomagnetic disturbance.9 These effects are real research, but weak, mostly ecological, and about storms, not about 7.83 Hz. Presenting a storm study as proof the Schumann resonance affects you is a bait and switch. If you want to understand your own physiology here, our guide to heart-rate variability is a better starting point than any Schumann chart.
Third, the popular “7.83 Hz matches your alpha brainwaves” line is a numerical coincidence. EEG alpha runs about 8 to 12 Hz, so 7.83 sits at its low, theta-facing edge, but overlapping numbers do not prove your brain “tunes in” to the sky. Your brainwave rhythms are electrical activity generated inside the skull; the Schumann electromagnetic frequencies are a weather signal in the sky. That two numbers land near each other does not connect them. The closest real evidence for audio frequency entrainment comes from binaural beats, where effects are modest and low-certainty at best.10 And listening to a 7.83 Hz track is sound played through a speaker, not the electromagnetic field: two different things we untangle on our 7.83 Hz explainer.
On safety, the reassuring news is that reviews by the WHO and ICNIRP find no established hazard from low-level ELF fields at the strengths we encounter in the environment.11 The natural Schumann magnetic field is measured in picotesla, vanishingly small. Do not confuse it with the far stronger milliTesla fields used in some laboratory EMF experiments or in PEMF therapy devices that advertise a “Schumann” setting; those are around a hundred thousand times stronger than the natural field and are a separate topic. A related idea claims that standing barefoot “reconnects” you to the 7.83 Hz field. It does not: grounding ties you to Earth’s surface charge, which is a different thing, as our Schumann resonance and grounding page and our broader grounding and earthing guide explain.
The single most useful habit is to keep the steady resonance and a geomagnetic storm firmly apart in your head. They get blended together constantly, and almost every overreaching health claim depends on that blur.
The live charts and the “spike” you may have seen
If you found this page after seeing an alarming coloured chart, here is what you were actually looking at. The famous images come from instruments like the Tomsk Space Observing System in Russia and from the HeartMath network. They are spectrograms: the vertical axis is frequency (usually 0 to 40 Hz), the horizontal axis is time in UTC, and colour shows power or amplitude.12
So a bright “spike” means more electromagnetic power at that moment, usually more or closer lightning or an ionospheric disturbance. It does not mean the base frequency changed. Two things fool people constantly: black vertical bars are simply missing data, and bright vertical streaks are local lightning near the sensor. It is also worth knowing that HeartMath, which runs some of the most-shared charts, is an advocacy organization built around a “global coherence” thesis, not a neutral geophysics authority. We walk through reading these charts, streak by streak, in the Schumann resonance today guide. The BBC’s own science explainer puts it bluntly: there is little to no evidence that the Schumann resonances affect biological life.13
As of 2026 the picture is stable, and a lot calmer than the headlines suggest: a well-understood piece of atmospheric physics that scientists use to watch lightning and study the ionosphere, wrapped in a layer of health folklore the measurements do not support.
Last reviewed July 2026.
Frequently asked questions
What is the Schumann resonance in simple terms?
It is a natural electromagnetic hum in the space between Earth’s surface and the ionosphere. Lightning strikes, about 50 a second worldwide, feed energy into this planet-sized cavity, and only certain wavelengths fit and reinforce. The strongest, the fundamental, sits near 7.83 Hz. It is real, measurable geophysics, not a mystical signal.
Is the Schumann resonance real or pseudoscience?
The resonance itself is real, settled physics, predicted in 1952 and measured continuously since the early 1960s. What is pseudoscience is the layer of claims built on top: that 7.83 Hz heals disease, tunes your brain, or is steadily rising toward 40 Hz. Keep the genuine physics and the wellness folklore firmly separate.
Why is the Schumann resonance 7.83 Hz?
Roughly, it is the frequency of an electromagnetic wave whose wavelength wraps around the Earth, near where light speed divided by the planet’s circumference lands. The idealized lossless formula actually predicts about 10.6 Hz; real ionospheric losses drag the observed value down to about 7.83 Hz. The number is a product of physics, not a chosen “healing” frequency.
Does the Schumann resonance affect the human body?
There is no proven health effect from the natural resonance, which is a picotesla-level field far too weak to feel. One small sleep trial and various geomagnetic-storm studies exist, but the storm research is about a different, stronger phenomenon and the direct 7.83 Hz evidence is preliminary. Reviews find no established hazard from ELF fields at natural strengths.
Is the Schumann resonance rising or changing?
No sustained rise has been measured. The fundamental fluctuates within a narrow 7.8 to 8.0 Hz band day to night and shifts about 0.1 Hz across the 11-year solar cycle, but it has stayed near 7.83 Hz since the 1960s. The “rising to 40 Hz” claim confuses harmonics, the chart’s axis, and short amplitude spikes with the frequency itself.
Did NASA say astronauts need a 7.83 Hz generator?
No. The claim that NASA installs 7.83 Hz generators because astronauts get sick without Earth’s frequency is undocumented folklore, spread mainly by device sellers. The real kernel is 1970s circadian research using a weak roughly 10 Hz field, not 7.83 Hz. NASA’s actual Schumann link is remote sensing, detecting the resonance from orbit.
How is the Schumann resonance measured?
It is recorded with sensitive induction-coil magnetometers and antennas at electromagnetically quiet sites, then shown as a spectrogram of frequency against time, with colour for amplitude. Networks like the Tomsk Space Observing System and the HeartMath magnetometers publish this live data. A brighter chart means more electromagnetic power from lightning, not a change in the underlying 7.83 Hz frequency.
References & sources
- Schumann resonances. Wikipedia. History, cavity model, frequencies and applications. en.wikipedia.org ↩
- NASA Scientific Visualization Studio. Lightning Reverb. About 50 flashes per second, ionosphere near 60 miles, VEFI remote sensing. svs.gsfc.nasa.gov ↩
- Besser BP. Synopsis of the historical development of Schumann resonances. Radio Science. 2007;42(2). doi:10.1029/2006RS003495 ↩
- Anisimov SV, et al. Mid-latitude Schumann resonance: frequency stability and solar-cycle modulation. Atmosphere. 2022;13(1):38. doi:10.3390/atmos13010038 ↩
- Vieira-Marques P, et al. Effect of a Schumann-resonance sleep device on insomnia: a double-blind randomized controlled trial. Nat Sci Sleep. 2022;14:1055-1066. doi:10.2147/NSS.S346941 ↩
- Mechanistic review of Schumann resonance and cellular effects. Electromagn Biol Med. 2025. Proposes calcium and radical-pair pathways; “further research required.” doi:10.1080/15368378.2025.2508466 ↩
- NOAA Space Weather Prediction Center. Geomagnetic storms. Definition and drivers. spaceweather.gov ↩
- Meta-analysis of geomagnetic storms and cardiovascular events. J Med Phys. 2025. Storms associated with MI/ACS relative risk about 1.3 to 1.5, stroke about 1.25 to 1.6. doi:10.4103/jmp.jmp_122_24 ↩
- Normative Aging Study cohort (n=809). Intense geomagnetic disturbance associated with reduced heart-rate variability. Sci Total Environ. 2022;838:156235. doi:10.1016/j.scitotenv.2022.156235 ↩
- Meta-analysis of theta binaural beats (13 RCTs, n=630). Explore. 2026. Low-certainty pain reduction, GRADE low. doi:10.1016/j.explore.2026.103471 ↩
- Repacholi MH, Greenebaum B. Interaction of static and extremely low frequency electric and magnetic fields with living systems (WHO/ICNIRP review). Bioelectromagnetics. 1999;20(3):133-160. No established hazard at low ELF levels. doi:10.1002/(sici)1521-186x(1999)20:3<133::aid-bem1>3.0.co;2-o ↩
- Schumann Resonances Conspiracy Theories. Wikipedia. How spectrograms are misread; charts track lightning, not consciousness. en.wikipedia.org ↩
- BBC Sky at Night Magazine. Schumann resonances explained. Explicit skepticism on biological effects. skyatnightmagazine.com ↩
Sources retrieved via PubMed and authoritative geophysics references. This article is informational and not medical advice. Last reviewed July 2026.